Has Bitcoin's security budget fallen over time?
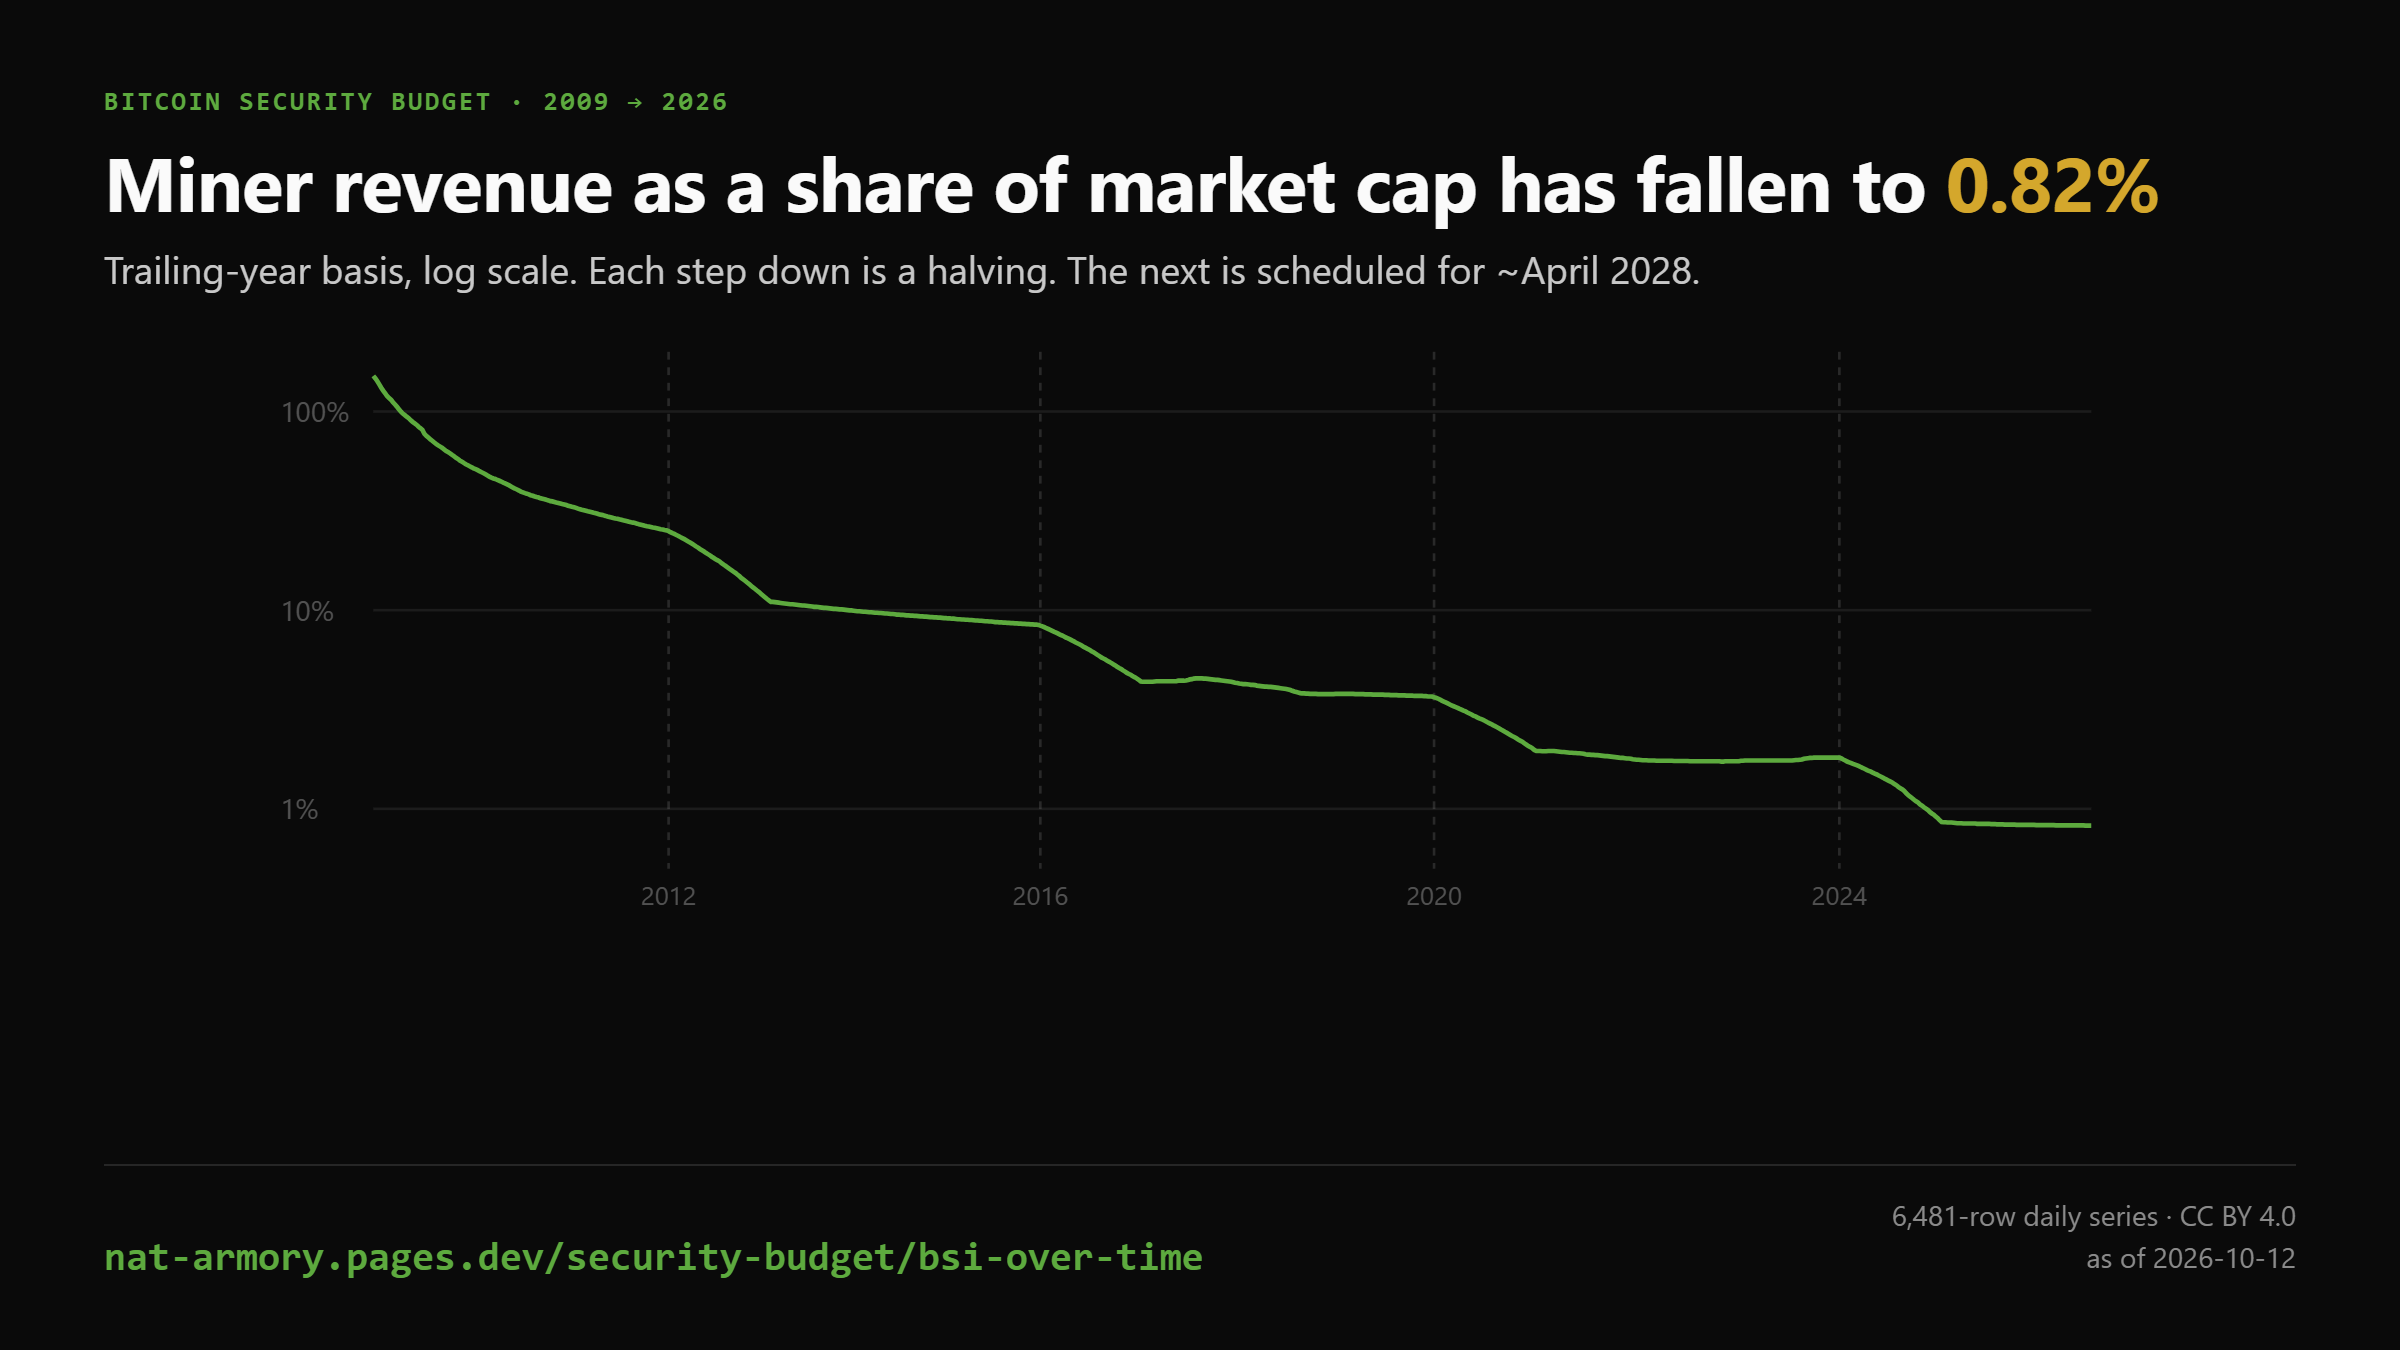
As of 2026-09-28, Bitcoin's security budget was 0.82% of market capitalisation a year, on a trailing-year basis. It was 25.03% at the first halving in 2012-11, 8.41% at the second halving in 2016-07, 3.66% at the third halving in 2020-05, 1.81% at the fourth halving in 2024-04.
At each halving
| Halving | BSI (trailing year) | Subsidy BTC/block | Fee share that day |
|---|---|---|---|
| 2012-11-28 | 25.03% | 25.0 | 0.52% |
| 2016-07-09 | 8.41% | 12.5 | 1.45% |
| 2020-05-11 | 3.66% | 6.25 | 4.57% |
| 2024-04-20 | 1.81% | 3.125 | 75.22% |
| Today (2026-09-28) | 0.82% | 3.125 | — |
The halving dates above are not typed in: they are the days the subsidy per block changes in the data. The fee share on the fourth halving is not an error — that was the day Runes launched, and fees briefly exceeded the subsidy.
The whole fall, without using price
| 2010-08-18 | 2026-09-28 | Change | |
|---|---|---|---|
| Paid to miners, trailing year (BTC) | 2,628,003 | 165,325 | ÷ 15.9 |
| Bitcoin in existence (BTC) | 3,752,500 | 20,090,528 | × 5.35 |
| BSI (trailing year) | 70.03% | 0.82% | ÷ 85.1 |
BSI is what miners are paid divided by the bitcoin in existence, so the first two rows multiply exactly to the third. Four halvings cut the subsidy per block by 16; fees and block timing account for the rest of the ÷ 15.9. No price appears in any row.
Over the same span the bitcoin price rose by a factor of 1,206,342. If price drove the ratio, it would read about 0.000058% today instead of 0.82% — wrong by roughly 14,000×. The decline is the halving schedule against a slowly growing supply, and nothing else.
How it is computed, and why no price forecast enters
BSI is annualised miner revenue over market capitalisation. Written out, that is (revenue in BTC × price) / (supply × price) — price cancels. So this series is computed as revenue in BTC over supply, and needs no historical price judgement at all.
The numerator does not come from a revenue-in-dollars series divided by a price. That route was tried and it is wrong by 13%: a daily average price does not reconcile with revenue accrued block by block, and it implies ~511 BTC/day where the chain paid ~453. Instead, the daily increase in supply is the subsidy actually paid, exactly, with no price in it. Blocks are counted from that increase rather than assumed at 144 a day. Fees are added on top and only they are converted at a daily rate — about 0.59% of revenue today, so even a large error there moves the ratio very little.
The reconstruction is checked against the live figure on every build: the last row lands within 0.02 percentage points of the 0.82% published across these pages, and reconstructed supply is within 0.01% of the circulating supply the market cap uses. If it diverges, nothing is published.
Two bases, as elsewhere
Each row carries bsi_spot_pct, a trailing seven-day per-block reward annualised — the basis these pages headline — and bsi_ttm_pct, the same construction over a trailing year, which is what the chart plots. A third basis, trailing revenue over spot market cap, is deliberately absent from the series: it rises when price falls, so seventeen years of it would chart an artefact of the denominator rather than a fact about security. Why the figures differ.
The data
bsi-series.csv · bsi-series.json — 6,466 rows, 2009-01-15 to 2026-09-28, CC BY 4.0. Columns: date, both bases, fee share, supply, subsidy per block, blocks per day, annualised revenue in BTC, and the day's price. Rows before today do not change; the file is appended to, not rewritten.
Use this chart
The chart above as an image, updated whenever the series is: bsi-chart.png. It carries this page’s address and the as-of date in the picture, so it stays traceable wherever it is pasted. CC BY 4.0 — use it anywhere, credit this page.
To embed it with the credit link already attached:
<a href="https://nat-armory.pages.dev/security-budget/bsi-over-time/">
  <img src="https://nat-armory.pages.dev/security-budget/bsi-chart.png"
       alt="Bitcoin’s security budget as a share of market cap, 2009 to today" width="1200">
</a>
Built from blockchain.info's own miner revenue, transaction fees, market price and total bitcoins charts. Re-derivable end to end from those four inputs.
How to cite it
Bitcoin Security Index, daily 2009–2026. NAT Armory.
https://nat-armory.pages.dev/security-budget/bsi-over-time/ (accessed 2026-09-28). CC BY 4.0.
Who publishes this, and the interest declared
This series measures Bitcoin. It is published by a project that proposes one of the answers to the problem it measures — a market-funded second subsidy — and that interest is declared on the about page rather than buried. Nothing on this page argues for it: the ratio, the method and the inputs stand on their own, and the other proposed answers are listed beside it.